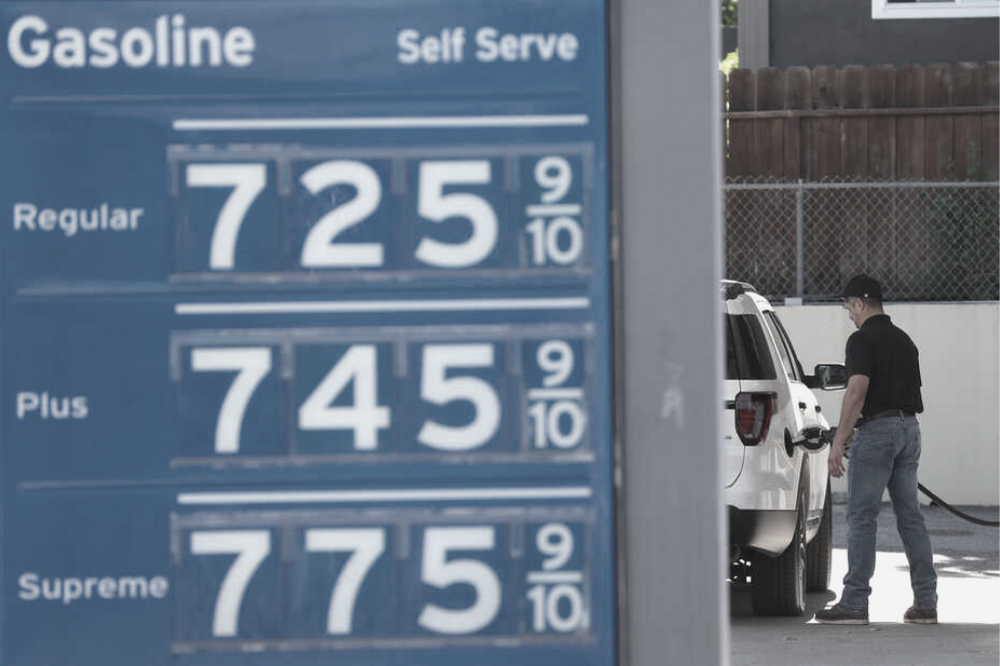
We’re now entering one of the more severe moments of this year. Market sell off, -5% last week with more losses coming in today. Inflation increasing despite rate hikes and the Fed’s promise of a ‘soft landing’. Energy cost at all-time highs with the national average at the pump now over $5/gallon for the first time ever. And the war in Ukraine showing us our dependence on a global economy for commodities.
Bitcoin, and the entire crypto market, now suffering heavily. The survival of tokens, coins, and other digital currencies will largely depend on utility in the coming months. Heavily speculative aspects of the market will likely continue to suffer massive losses.
Allocation is king during times of systemic fear. Seeking out companies who create true an inherent value for society is always the best route – but now more than ever.
Below is your Weekly Market & Economic Update by the numbers.
Interested in learning more? Schedule a call with me HERE.
Warmly,
Mark Sauer
info@AllOneWealth.com
+1(310)355-8286
Weekly Market Update
- Global Equities: Equity markets were on edge all week awaiting Friday’s Consumer Price Index (CPI) release and sold off sharply in response to yet another hot inflation reading. The S&P 500 closed the week down -5.0%, bringing the index close to the year-to-date lows of May. The Nasdaq was down -5.6% during the week, and the Dow Jones Industrial Average slipped -4.6%. Developed International markets also sold off sharply, as the European Central Bank joined the Fed in announcing rate hike plans. Developed International stocks were down –5.1%. Emerging Markets displayed relative strength despite renewed lockdowns for COVID in China, with a weekly loss of -2.1%
- Fixed Income: 10-Year Treasury yields surged on the Friday inflation report, hitting 3.17%. The yield curve continued to flatten as 2-Year Treasury yields hit 2.99%, the highest level since 2008. High yield bonds, which had seen roughly $6 billion in inflows over the past two weeks, sold off sharply on Friday, giving back their recent gains and losing –3.8% during the week.
- Commodities: Oil prices exceeded $120 per barrel during the week, as several analysts projected prices to hit $150 this year on limited refining capacity. Friday’s CPI data revealed a 34.6% year-on-year increase in the energy index component, the largest annual increase since September 2005. Fuel oil costs have risen 106.7% year-on-year, the largest annual increase in the history of the data series, which goes back to 1935.
Weekly Economic Update
- No Peak for Inflation? There was some chatter in recent weeks that perhaps inflation had peaked, and new data would show improving conditions that would allow the Fed to execute a series of measured rate increases and guide the economy to a “soft landing.” The May CPI data, however, showed no relief for consumers with a year-over-year headline increase of 8.6%, higher than the prior month’s 8.3%. The Core CPI, ex-food and energy, was down year-on-year, declining from 6.2% in April to 6.0% in May. Expectations for a 75-basis-point Fed rate hike in June increased from under 4% prior to the CPI data to 17% following its release, per data from CME Group.
- Record Low Sentiment: The University of Michigan Consumer Sentiment Survey fell sharply in June to a record low of 50.2, down from 58.4. Higher gasoline prices and overall inflation have weighed on consumer’s attitudes, but the grim outlook has not yet impacted spending behaviors for items such as restaurant meals, airline tickets, and hotel rooms. There are some signs that consumers are cutting back in other ways, however, as earnings from discount dollar stores were strong in Q1 while other retailers have struggled.
- Home Sales Decline: Luxury home sales fell 17.8% year-on-year during the 3-month period ended April 30th, the largest drop since the onset of the COVID pandemic. Non-luxury home sales also declined to a lesser extent, falling 5.4%. Higher monthly mortgage payments are a clear deterrent, with the 30-year fixed rate loan now averaging 5.23%, driving mortgage applications down –6.5% during the week.
Chart of the Week
The Chart of the week is a breakdown of the May CPI reading which spooked markets on Friday leading to a broad sell-off, ahead of the June 15th Federal Open Market Committee meeting. While Core Inflation (white dashed line) eased, the continuous increase in the Services component excluding food and energy (blue bars) is of concern. Eyes now turn to the Fed, to see if they will get more aggressive with rate increases on June 15th. Energy and Food prices may be beyond the Fed’s influence, being heavily impacted by the war in Ukraine, but an aggressive rate hike could help slow inflation in service-related industries.

Data Source: Hanlon Investment Management


